
Demographic Profile
The Census usual resident population of Thornlands in 2016 was 14,685, living in 5,182 dwellings with an average household size of 2.92. There were 274 people over the age of 85 living in Thornlands in 2016, with largest age group being 15 to 19 year olds.
The Age Structure of Thornlands provides insights into the suburb’s age profile which is a key consideration during disaster preparation, response and recovery to accommodate the needs of the community. It is also an indicator of Thornlands’ level of demand for age based services and how it is likely to change in the future.
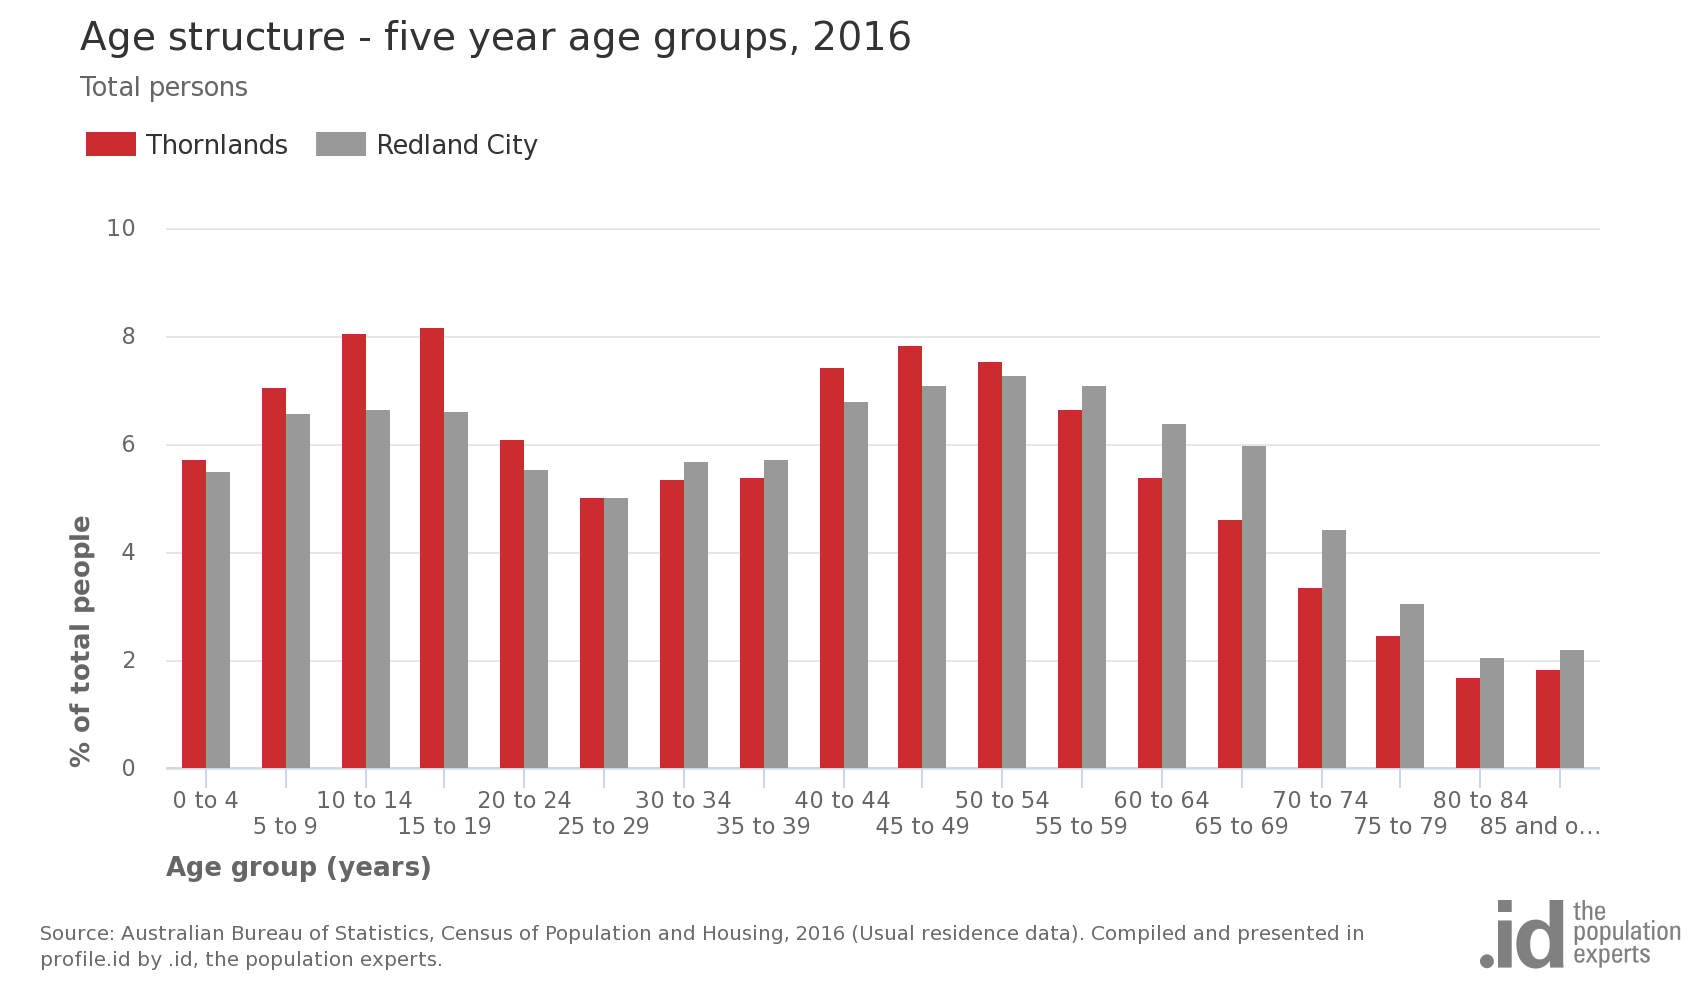
Analysis of the five year age groups of Thornlands in 2016 compared to Redland City shows that there was a higher proportion of people in the younger age groups (under 15) and a lower proportion of people in the older age groups (65+). Overall, 20.9% of the population was aged between 0 and 15, and 14.1% were aged 65 years and over, compared with 18.8% and 17.8% respectively for Redland City.
The major differences between the age structure of Thornlands and Redland City were:
- A larger percentage of persons aged 15 to 19 (8.2% compared to 6.6%)
- A larger percentage of persons aged 10 to 14 (8.1% compared to 6.7%)
- A smaller percentage of persons aged 65 to 69 (4.6% compared to 6.0%)
- A smaller percentage of persons aged 70 to 74 (3.4% compared to 4.5%)
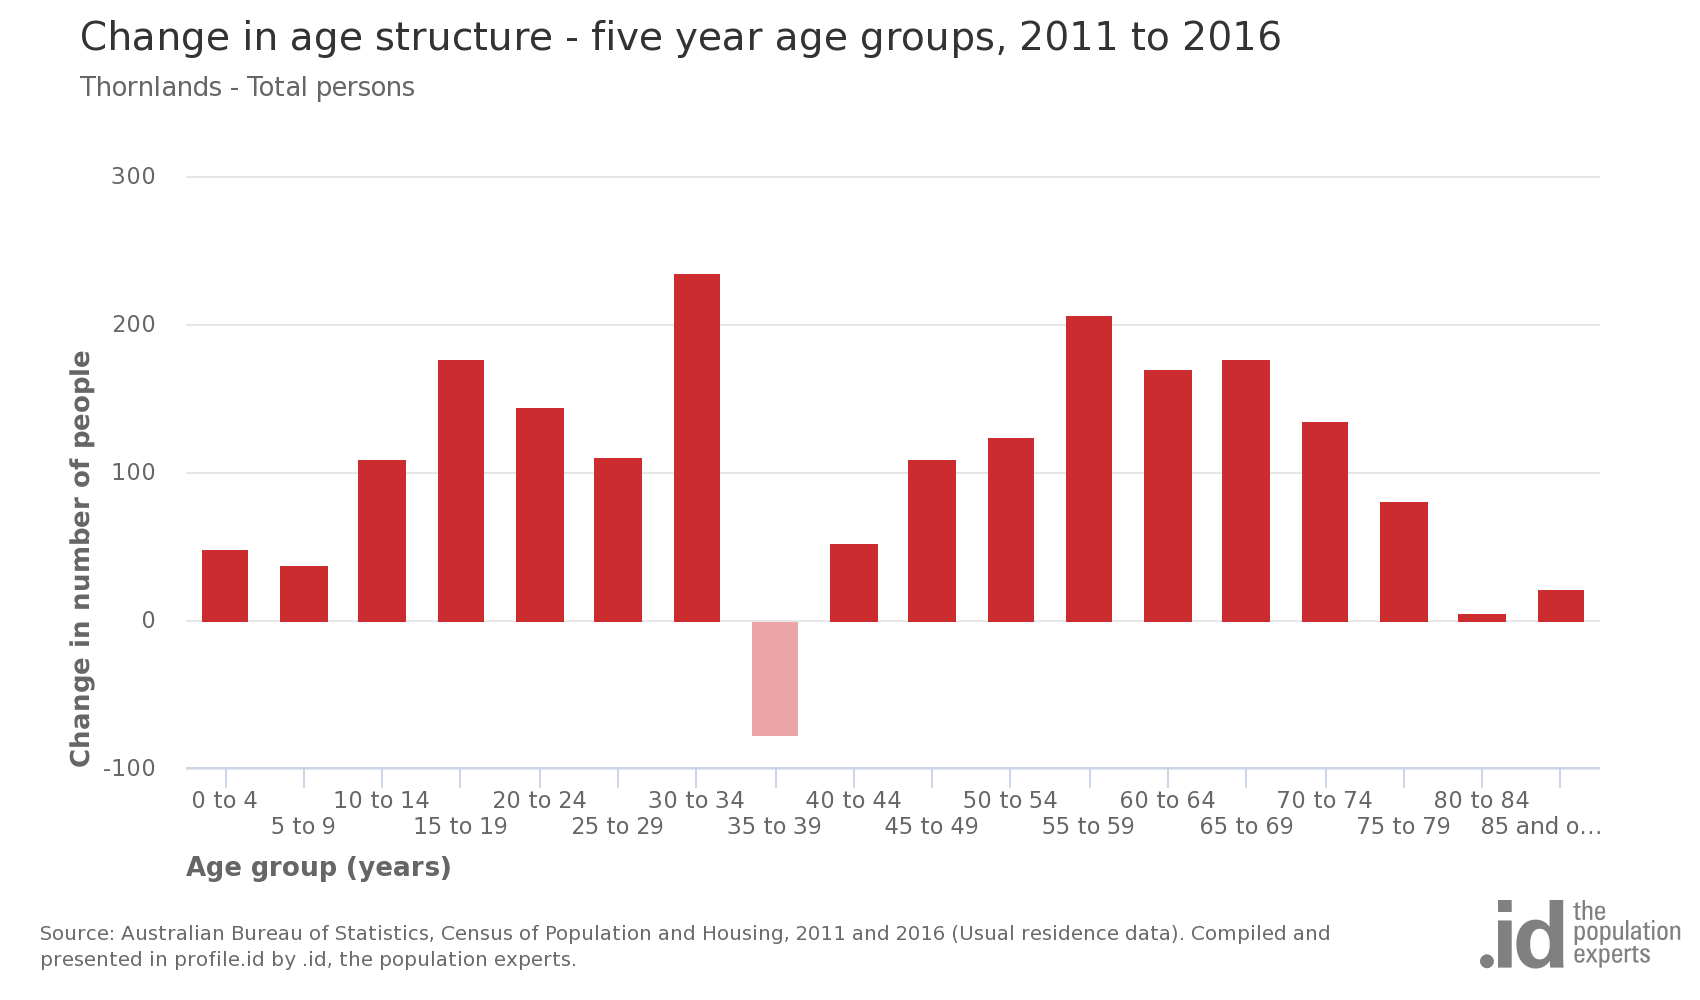
From 2011 to 2016, Thornlands’s population increased by 1,869 people (14.6%). This represents an average annual population change of 2.76% per year over the period.
The largest changes in age structure in this area between 2011 and 2016 were in the age groups:
- 30 to 34 (+235 persons)
- 55 to 59 (+207 persons)
- 15 to 19 (+177 persons)
- 65 to 69 (+177 persons)